

Progress monitoring graphs take different shapes. Some are flat. Others are perfect. Some are fast. The best are authentic. In this post we will look at the flat graph. Ever wonder why student progress flat lines? Here is what to think and do when progress is flat.
What is a flat graph?
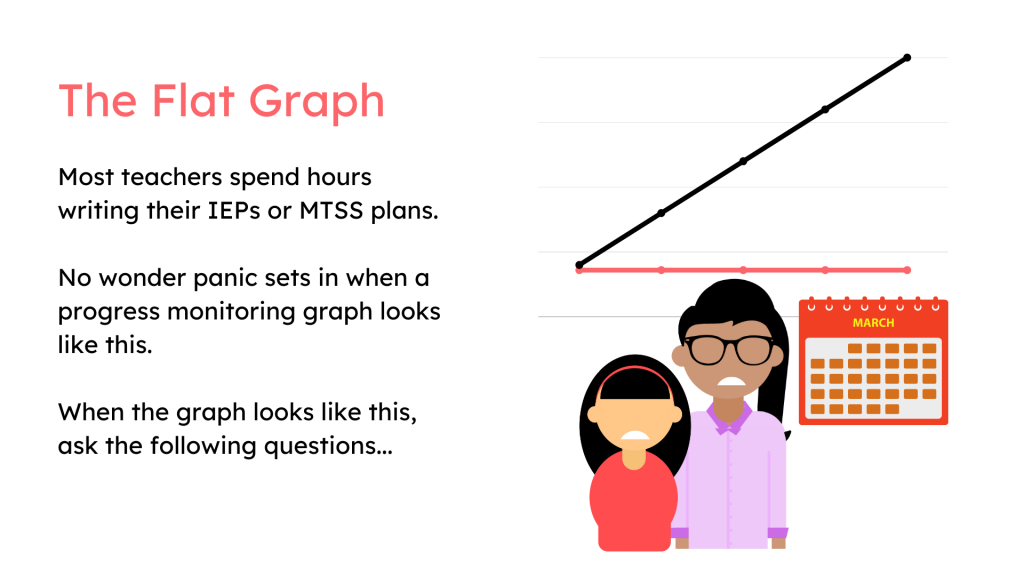
According to IDEA and State Rules, progress monitoring procedures must be established for each goal in your plans. But what happens when a student does not show adequate progress? A flat graph is graph that shows little to no progress over a sustained period of time. In the graph below the aim line, or target, is black. The red line represents the progress the student has made so far. Uh oh.
Looking for solutions for flat graphs? Here are some ways we can help.
DOT IT software and professional learning makes it quick and easy for teachers and teams to purposefully connect impacts and problems to compliant high quality plans. It provides simple drop down menus for error free planning. No more guessing and wordsmithing! DOT IT also makes it easier for teachers to put their plans into consistent practice. Contact us here. Or, message me on Linked In.
Looking forward to connecting with you!
Susan